Working with Interactive Reports
Meevo Interactive Reports provide data in an adjustable table format, allowing you to create customized views of targeted information. The tables can be adjusted in a number of ways including removing or resizing columns, filtering data by typeahead search, and sorting on column names to create your desired views.
Tip: Saved views are specific to each login, so users can personalize these reports to display the data that they want to see.
All Interactive Reports also offer a "What You See Is What You Get" export option, meaning the CSV export will exactly reflect the view on-screen.
Adjusting Columns and Rows
Sorting columns in Ascending or Descending order
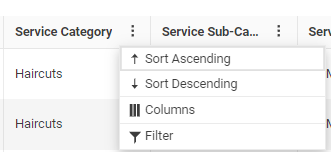
Select the vertical ellipses beside a column and select Sort Ascending or Sort Descending.
Alternatively, select a column to sort the data by that column in ascending order. Select the column again to sort the data by that column in descending order, and select it once more to reset the column sorting to it's default.
Resizing columns
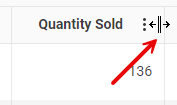
To resize a column, hover over a column edge and drag it to size when the cursor changes to arrows.
Hiding columns
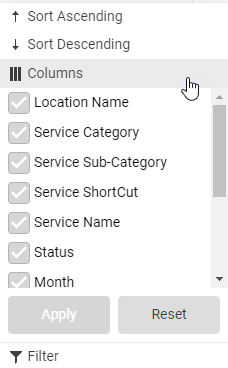
To hide a column, select the vertical ellipses beside any column (it does not need to be the one you're hiding) and select Columns.
Select or deselect a column to show or hide it, respectively. Select Apply when finished.
To reset columns back to the default, select Reset.
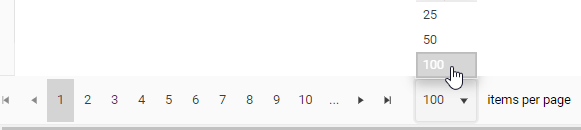
Changing the number of rows per page
Adjust the number of rows/items per page using the items per page option at the bottom of the report. You can list up to 100 items per page.
Adjusting Report Data
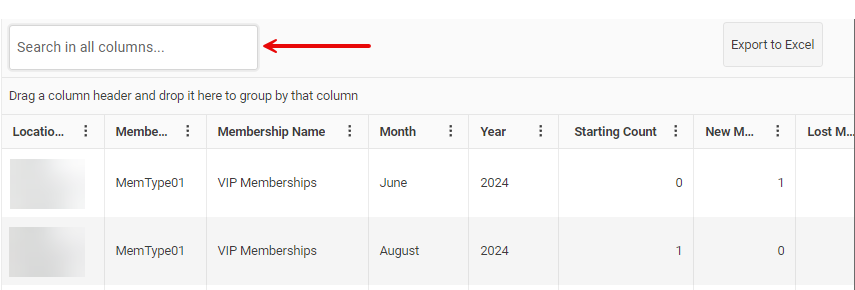
Searching within in the report (typeahead search)
Use this search to filter the data to a specific category, item, quantity/count, amount, or year. As you enter text or digits into the typeahead Search box, only records with data that matches what was entered appear in the list. Meevo attempts to match on data in all columns on all pages of the report with the exception of the Month column.
Tip: To group data by month, drag the Month column header to the top of the report. See Grouping data below for details on how to group data by columns.
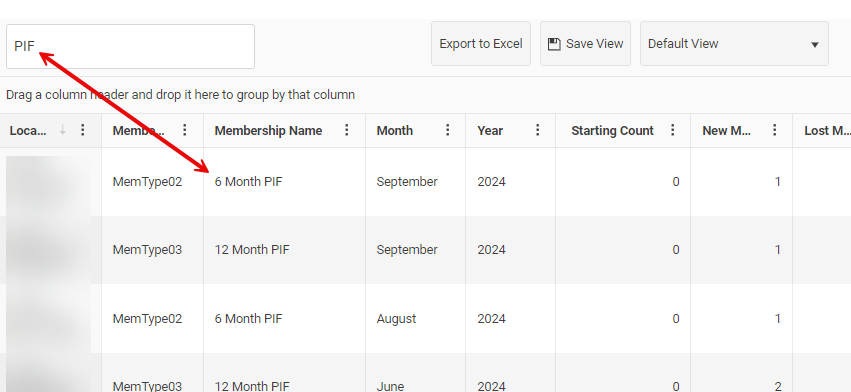
The data in the report is immediately filtered and updates to display only those rows that contain a match to what was entered in search. If you save the view, the entered text will be returned in the Search box when you select the view.
Below, we are creating a view to look at Paid-in-Full (PIF) membership data only.
Grouping data
Data can be "grouped" by one or more columns, allowing you to carve up and organize the data as needed.
Tip: When you group data, aggregate subtotals appear below each group. Grouping data is the only way to see aggregate totals on-screen.
To group your data, drag a column to the top of the report, below the typeahead search. For example, drag the Product Name column to the grouping menu to organize the products by name. Notice the subtotals that appear below each group.
Note: With the exception of the Year column, columns that display numeric values such as Quantity Sold and Amount Sold cannot be grouped.
Grouping multiple columns
Grouping several columns at once can refine and organizes the data. When you group multiple columns, the data is structured based on the order of the column groupings, from left to right.
To see the products organized by Product Sub-Category, we'll drag the Product Sub-Category column to the groupings menu. We want that to be the primary sort, so we'll make it first in the list.
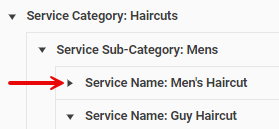
Finally, let's add Product Categories as the highest level grouping so that our data is organized like this: Product Categories > Product Sub-Categories > Product Names.
Working with grouped data
Collapse or expand groupings using the triangle to the left of the grouping name.
To change how the groupings are sorted (for example, to sort the Service Categories in reverse alphabetical order), click the arrow to the left of the column grouping name.
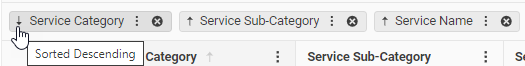
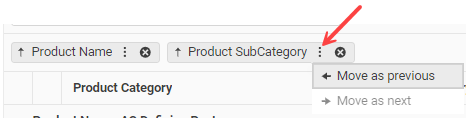
To reorder the groupings, drag a tab to your desired order, or select the vertical ellipses menu beside a column name.
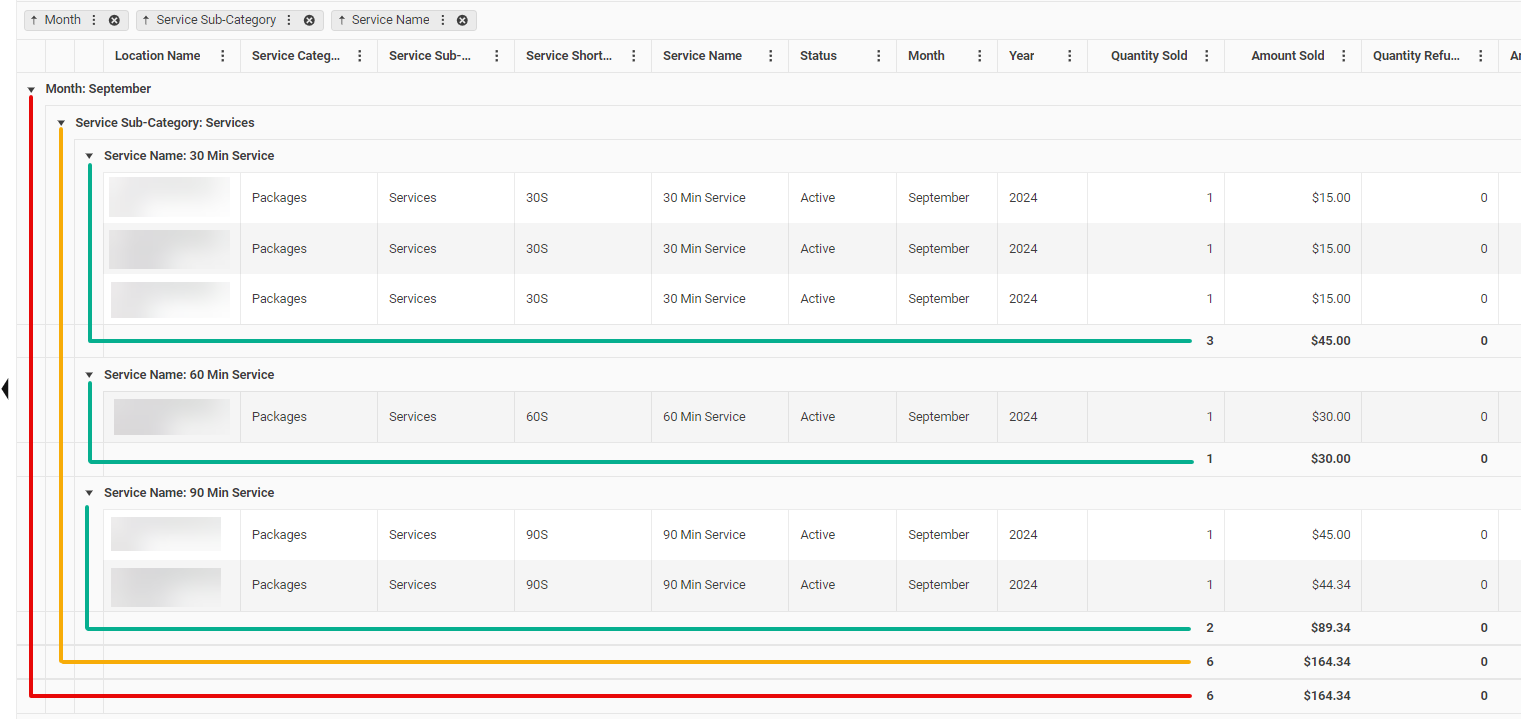
When using multiple groupings, aggregates appear for each group of data like in the image below.
Advanced filtering (with operators)
To filter on specific information within a column, select the vertical ellipses beside the column and select Filter.
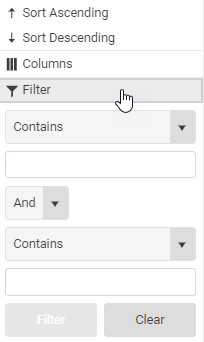
- Contains: Returns data that matches what is entered, even if it's not the entire word or value. For example, searching on "mass" will return rows with the word "massage."
- Is equal to: Returns data that is exactly the same as what is entered.
- Is not equal to: Returns data that is not exactly the same as what is entered.
- Does not contain: Returns any data that does not contain what is entered. For example, searching on "mass" will not return "massage," but will return a word like "manicure" since manicure is not a substring of massage.
- Starts with / Ends with: Returns data that begins with / ends with what is entered.
- Is null: This returns any row that has a cell with no data.
Exporting data to Excel
Select Export to Excel to download a local copy of the data, configured exactly how you have it in the current view.
Managing Views
If you manipulate the table in any way, your changes become a "view" of the table that you can save for later use.
When you save a view, you are saving exactly the view you see on-screen. All configurations, including the date range, selected locations, and changes to the table are saved. Saved views can be recalled easily and quickly from the drop-down at the top of the report.
Saving a new view
- Configure the data in the table as you'd like, and when ready, save the view:
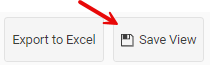
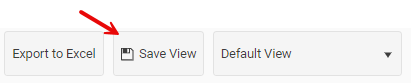
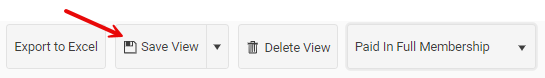
- If you have no saved views, select Save View from the toolbar in the top-right of the report.
- If you have saved views but you are on the Default View, select Save View.
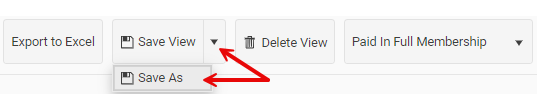
- If you have saved views and one is currently selected, save a new view by selecting Save As from the "Save" drop-down:
- If you have no saved views, select Save View from the toolbar in the top-right of the report.
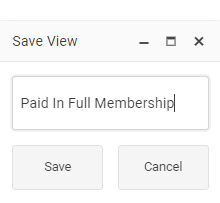
- In the Save View modal, enter a name for the view that makes it easy to recognize and select Save.
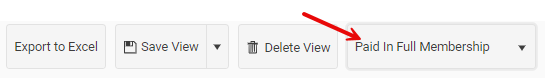
- The view now appears in the "views" drop-down located at the top-right of the report. Note this drop-down will only appear once you've saved at least one view.
Updating an existing view
Select the view from the drop-down, modify the table as desired, and then select Save View to update the currently selected view.
Deleting a view
To delete a view, select the view from the drop-down and then select Delete View. Select Delete on the confirmation prompt to completely remove the view. Deleted views cannot be recovered.