Creating a Chart with Chart Designer
Chart Designer is a drag-and-drop interface for creating chart pages and customizing templates without requiring a developer. A chart can contain one page or multiple pages that providers complete in the order you configured.
Note: Even if you choose Customize a Template in Chart Builder, you'll be taken to Chart Designer to make your customizations after selecting a template.
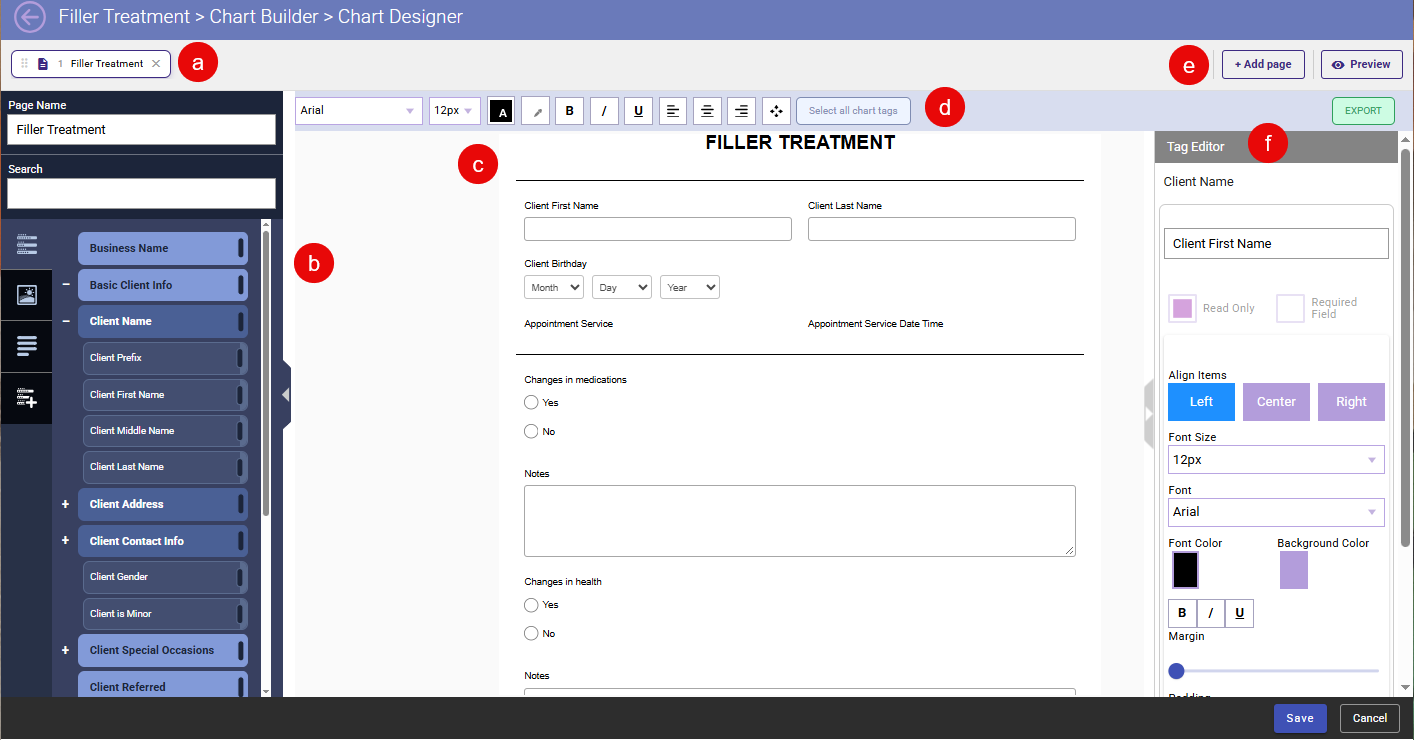
- The page tabs display the pages currently included in the chart. Select a tab to work on that page or drag it to change the page order.
- The left column slideout lists various elements that you can add to the chart, like tags and images. Elements can be added by double-clicking the tag or dragging-and-dropping the tag. Double-clicking or dragging the "parent" tag will add all of its sub-tags to the chart.
- The workspace is a dynamic preview of the chart as it's being built. You can reorder, edit, or delete components in the workspace.
- Use this toolbar to customize all tags within the selected group. Note that in addition to changing the font, font size, color, and alignment, you can also edit the padding and margins.
- Here is where you can add another page to the chart (+Add Page), export the chart's HTML, or Preview the chart as it would appear on various devices.
- The Tag Editor is where you can change the look and behavior of individual tags in the chart.
Important: Meevo is a HIPAA-compliant platform. If you are collecting client data, it is your responsibility to use this platform according to HIPAA regulations.
Note: To avoid issues with the chart's usability, do not include any external links, and do not apply custom styling. Use Meevo's provided styles instead. Including either of these elements in a chart can cause undesired results.
Working with Chart Pages
The layout initially created from Chart Builder becomes the first page of the chart.
Each page appears as a tab across the top of Chart Designer. Arrange the tabs in the order providers should complete them. Select a tab to open and edit that page.
To add a page:
- Select + Add Page.
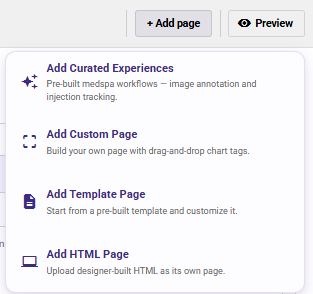
- Choose the type of page you want to add:
- Add Curated Experiences: Add a pre-built page for image annotation, injection tracking, or product-usage documentation.
- Add Custom Page: Build another page using the drag-and-drop Chart Designer.
- Add Template Page: Start with a pre-built template and customize it.
- Add HTML Page: Upload a custom page created in HTML.
- Configure and name the new page. Repeat these steps for any additional pages.
- Arrange the page tabs in the order providers should complete them.
- Select Save to save the chart layout.
You can add multiple pages of the same type, except for the Product Usage Table, which can be added only once to a chart definition.
Add Curated Experiences (Image Annotation and Product Tracking)
Select Add Curated Experiences to choose from these pre-built annotation/product usage templates:
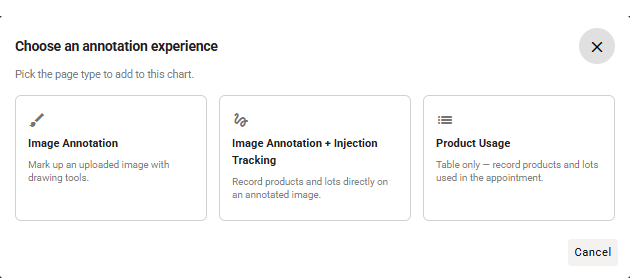
- Image Annotation: Allows providers to mark treatment areas directly on an image. Multiple Image Annotation pages can be added for different images or treatment views. This page provides visual documentation only and does not record or send product usage to the Register.
- Annotation + Injection Tracking: Combines image annotation with the Inject tool so providers can mark injection sites and record the related service, product, lot, treatment area, and units administered. Product usage recorded on this page can be sent to the Register by selecting Ready for Checkout.
- Product Usage Table: Provides a structured table for recording products, lots, treatment areas, units, and optional notes without an annotation image. The table includes Product, Lot #, Areas Treated and Units, and Notes. Product usage recorded on this page can be sent to the Register by selecting Ready for Checkout.
- The Notes field is always available and optional.
- Lot information is required only when the selected product is configured to Track Lots.
- The table cannot be added more than once to the same chart definition.
Note: Charts containing Annotation + Injection Tracking or a Product Usage Table cannot be selected for ad hoc charting because product usage must be associated with an appointment service.
The Left Column Slideout
System Tags
System Tags can be used to customize the chart to the client, as tags are automatically populated with the client's appointment, service, and other details when the chart is opened.
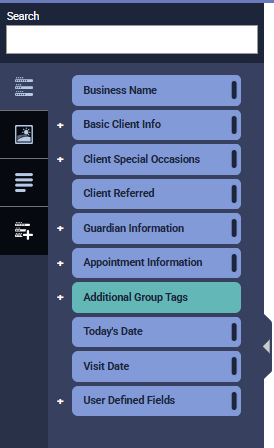
Below are some important things to know about System Tags:
- Double-click or drag-and-drop a tag from the left column to add it to the workspace. Tags can be placed on the same line, but some tags may need their Block Width (under Additional Options) reduced to fit other tags on the same line.
- Select Required to make that field required when the chart is being filled out; a user will be unable to submit the chart until all required fields (identified by an asterisk) on the chart are completed.
- System Tags are read-only in Charts, so employees will not be able to edit the information within those fields on a chart.
- Completing or updating a User Defined Field (UDF) in a chart and saving the chart will update the corresponding UDF in the Client profile.
- Today's Date is a read-only field that auto-populates the current date whenever an unsubmitted chart is opened. Unlike the standard "Date" Custom Chart Field, this tag is not editable to ensure accurate record keeping. We recommend using this tag alongside signature fields to ensure compliance and to protect your business from potential disputes.
- For multi-locations that may inherit a template from Central Office, the Business Name tag will honor each individual location’s Business Information Name field.
Images
Note: To add a pre-built page on which providers can annotate treatment areas, select + Add Page and choose an annotation option under Add Curated Experiences.
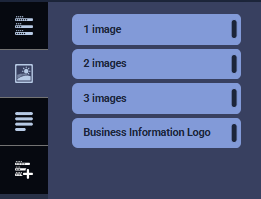
- You can add one image or a row of two or three images to the chart. Images must be larger than 1x1 pixels, cannot be greater than 5 MB in size, and must be a .jpg, .png, .gif, or .jpeg.
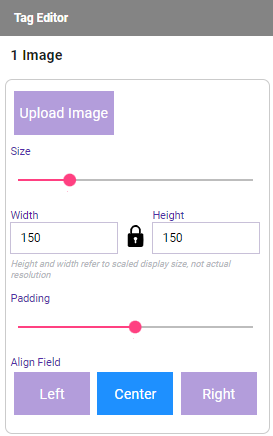
- To upload an image, select edit in the image tag to reveal the Tag Editor. Select Additional Options from the Tag Editor and then select Upload Image. You can also change the image label here.
- The Business Information Logo tag pulls in the logo you uploaded in the Business Information > Main tab. If the location does not have an uploaded logo, then Meevo will use the logo that was uploaded in Central Office.
Copy/Text
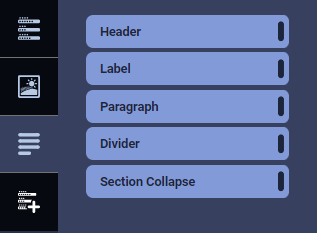
The Copy/Text elements are where you can add headers, labels, and paragraphs to your chart. Basically, these are text boxes that you can add to the chart to provide information not covered in System Tags.
- Use the Header to add a heading or new section to the chart.
- Use Label to add a text string.
- Use Paragraph to add a block of text.
- Use the Divider to add a horizontal dividing line to illustrate that sections are separate from one another.
- Use Section Collapse to create a collapse/expand section on the chart. All tags within the blue outline will be included in the collapsible/expandable section.
Custom Chart Fields
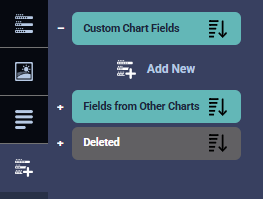
Custom Chart Fields are custom fields that you can create while building the chart. Custom Chart Fields can be created once and reused across multiple charts, making it easy to standardize documentation while minimizing ongoing maintenance.
- To create a Custom Chart Field, select Add New to open the Add New Field window. Then, refer to Adding a User Defined Field for step-by-step guidance on filling out these fields, and note the following:
- Once data has been collected against a Custom Chart Field (for example, an employee fills out the field and submits the chart), the Custom Chart Field cannot be deleted.
- There are additional Field Types available in Meevo Charts that are not available in standard UDFs: Signature, Signature (Initials Only), and Markup/Annotation. The signature fields allow a client to sign digitally using a mouse or touch screen, while the markup field allows a client to "mark-up" an image.
- To use a pre-built annotation workflow, or combine annotation with injection tracking, add a Curated Experience page instead.
- To re-use an existing Custom Chart Field from another chart, expand the Fields from Other Charts drop-down. Note that if you edit one of these Custom Chart Fields, the field will be updated across all charts that use it.
- While creating Custom Chart Fields, be sure to follow these guidelines:
- Do not change the size of signature field types. If you change the aspect ratio or "stretch" the signature fields types, this can cause issues with how client signatures appear on the chart.
- To resize a markup/annotation image, you'll need to use the canvas tags in the chart that appear after enabling the markup field.
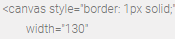
- UDF Field Types Document Upload and Image Upload are not available in Chart Builder.
Copying a Custom Chart Field
You can copy any Custom Chart Field as many times as needed, allowing you to capture multiple signatures, repeat date entries, or other recurring pieces of information within the same form.
- To duplicate a field, click the Copy icon next to the chart field that you want to reuse. The icon can be found beside the field within the Custom Charts Fields tab (below, left) and beside the field itself within Chart Designer (below, right).
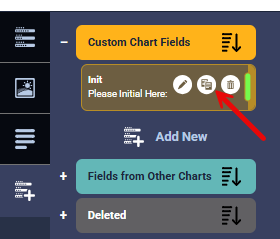
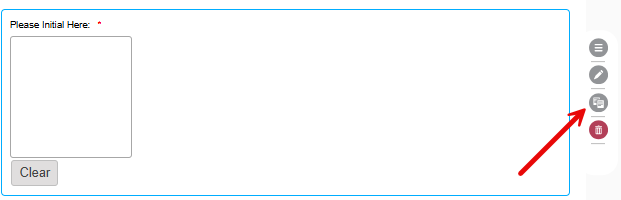
- In the Copy Field modal, give the new field a unique name and make any other adjustments if needed.
- Once saved, the duplicated field is added to your list of available Custom Chart Fields.
- If you copied the field from the left sidebar, you must manually add the new field to the chart.
- If you copied the field from within the chart, the new field is automatically placed below the copied field.
The Workspace
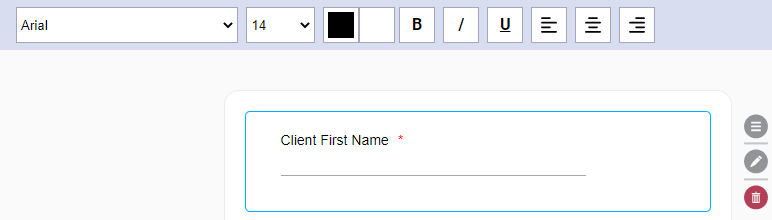
The workspace helps you to visualize how the chart will appear to employees. You can edit the styles of tags from here or by using Tag Editor.
- The toolbar at the top of the page provides style tools you can use to modify the text.
- The three icons to the right of the tag are:
 Select and hold this icon to drag the tag to another spot in the workspace.
 Select this to open the Tag Editor, where you can further customize the tag and mark is as Read Only or Required.
 Select this to remove the tag from the workspace. This also deletes any styles you applied to the tag.
Tag Editor
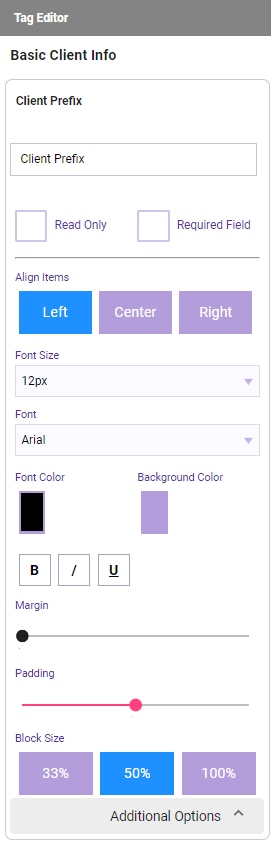
- Use Tag Editor to mark a tag as Required.
- Select Additional Options to customize the style of the tag, just as you can using the workspace toolbar.
To Preview the Chart
Select Preview in the top-right corner to review the chart as providers will see it. For a multi-page chart, Preview displays the pages in their configured order so you can verify the complete workflow on different device sizes.

To Save and Activate the Chart Definition
- When finished creating your chart, select Save.
- Be sure to go back to the Main tab of the chart definition and activate this chart by toggling the Inactive switch to Active.