Building a Chart Layout
After creating a chart definition, the next step is to design the information that your chart will capture from a client visit. A chart can contain a single page or multiple pages that bring different stages of the treatment workflow together.
Choose how to build your chart
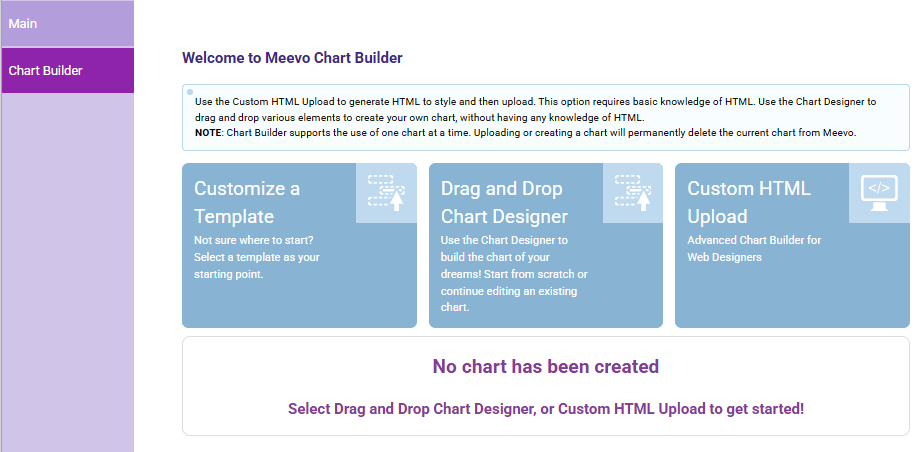
When you open the Chart Builder tab, you can choose how you want to create your chart:
- Customize a Template (recommended): Start with a predesigned template, such as a Filler Treatment or Good Faith Medical Exam, and customize it to fit your needs. After selecting a template, you’ll be taken directly to the Drag and Drop Chart Designer. For most businesses, starting with a template is the fastest and easiest way to build a chart.
- Drag and Drop Chart Designer: Use the intuitive Drag and Drop Chart Designer to create charts from scratch or customize existing templates with no technical experience required.
- Custom HTML Upload: Web designers can upload custom charts in HTML format. We recommend going into Drag and Drop Chart Designer, selecting your desired tags, exporting the HTML, and then uploading the final version to Custom HTML Upload.
After the initial page opens in Chart Designer, you can name the page and select + Add Page to build a multi-page chart. See Creating a Chart with Chart Designer for instructions on adding, configuring, and arranging pages.
Important: Meevo is a HIPAA-compliant platform. If you are collecting client data, it is your responsibility to use this platform according to HIPAA regulations.
How User Defined Fields work with charts
Completing or updating a User Defined Field (UDF) in a chart and saving the chart will update the corresponding UDF in the Client profile.
How System Tags work with charts
System Tags pull existing information, such as a client’s name or appointment details, directly into a chart. When the chart is opened, any System Tags with corresponding data in Meevo are automatically populated.
System Tags in Charts are read-only, meaning employees cannot edit that information directly within a chart.